When using Power BI you may accumulate a number of measures used to perform calculations and display these results in a Matrix visualization. The default format that Power BI will arrange these data fields is to display the measure values in the columns, but what happens if you want to display measure values in rows? This quick guide will document how to perform this with a quick setting change within the visualization.
Default Measure Values in Columns
For this examples we will be using the following dataset:
| Product ID | Country | Volume | Month |
| Product 4 | Canada | 6,988 | 1/1/2020 |
| Product 2 | United States | 2,717 | 1/1/2020 |
| Product 8 | Mexico | 2,731 | 1/1/2020 |
| Product 4 | Canada | 1,885 | 2/1/2020 |
| Product 3 | United States | 3,094 | 2/1/2020 |
| Product 9 | Mexico | 8,626 | 2/1/2020 |
| Product 2 | Canada | 5,271 | 3/1/2020 |
| Product 5 | United States | 3,919 | 3/1/2020 |
| Product 7 | Mexico | 7,145 | 3/1/2020 |
| Product 3 | Canada | 8,857 | 4/1/2020 |
| Product 2 | United States | 7,037 | 4/1/2020 |
| Product 1 | Mexico | 8,046 | 4/1/2020 |
| Product 10 | Canada | 9,812 | 5/1/2020 |
| Product 9 | United States | 9,547 | 5/1/2020 |
| Product 2 | Mexico | 5,647 | 5/1/2020 |
| Product 1 | Canada | 5,797 | 6/1/2020 |
| Product 6 | United States | 2,610 | 6/1/2020 |
| Product 10 | Mexico | 4,141 | 6/1/2020 |
Even though its not required for the purpose of this example we will create two new measures to sum the volume of Product 2 and 3 using the Calculate() syntax.
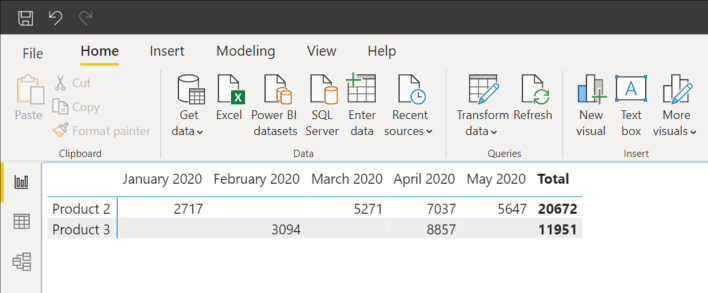
Product 2 = CALCULATE(SUM(Sheet1[Volume]),Sheet1[Product ID]="Product 2") Product 3 = CALCULATE(SUM(Sheet1[Volume]),Sheet1[Product ID]="Product 3") When we create a matrix visual with the Product 2, Product 3 and Month variables Power BI will default the visual to display the measure values in columns.
You will notice that if you try move the Product 2 and Product 3 measures into the rows field, they will stay in the values field.
Measure Values in Rows
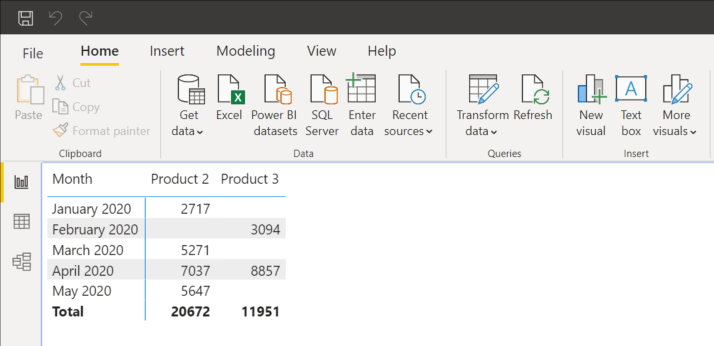
To allow us to properly display the month values across the top of the matrix and the measure values in the rows we simply navigate over to the format tap of the selected visual, select the values section and click show on rows.
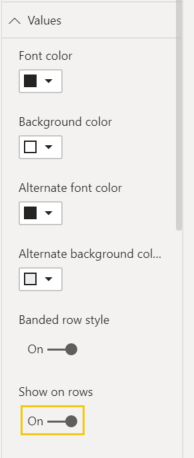
You will notice that the measures automatically move on the rows and provide the desired formatting.