This step by step guide will walk through a method of converting row data into columns with a Modulo column. A relatively common issue when building Power BI models is when the input data is formatted in rows versus columns. This is because Power BI works best with data formatted into columns since the software uses database logic and formatting. There is a way to accomplish this by using a Modulo column in Power Query and pivoting the data in a specific way that allows us to convert the data into a usable format. This guide will hopefully provide some ideas for your specific use case and reduce the need for any manual formatting of your data.
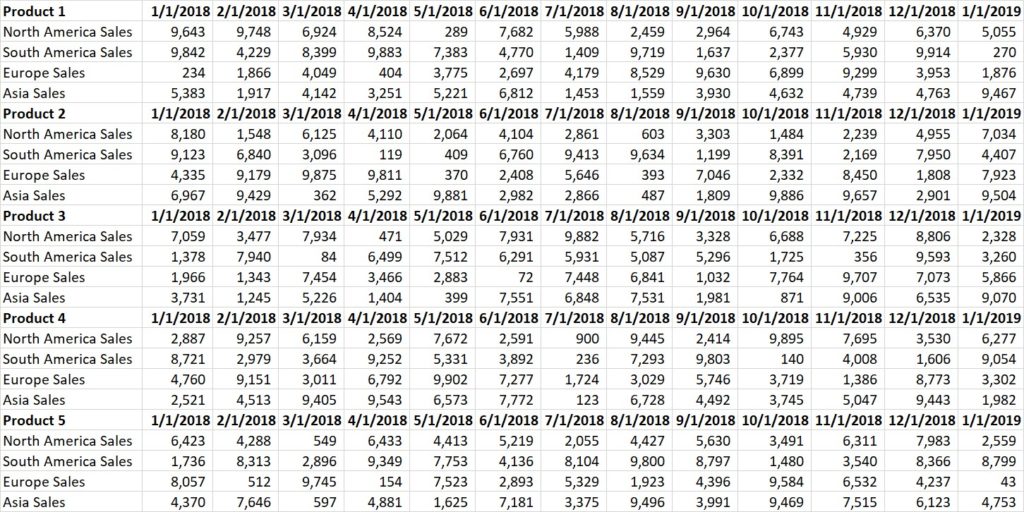
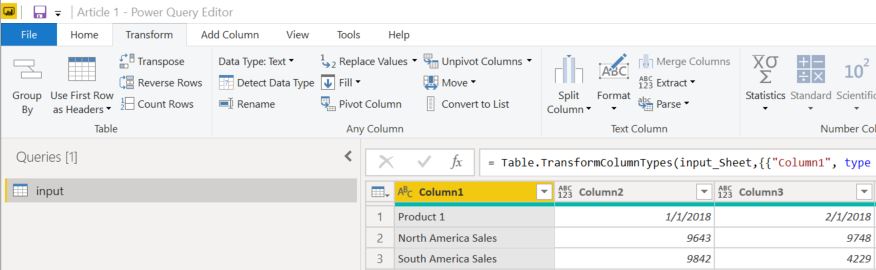
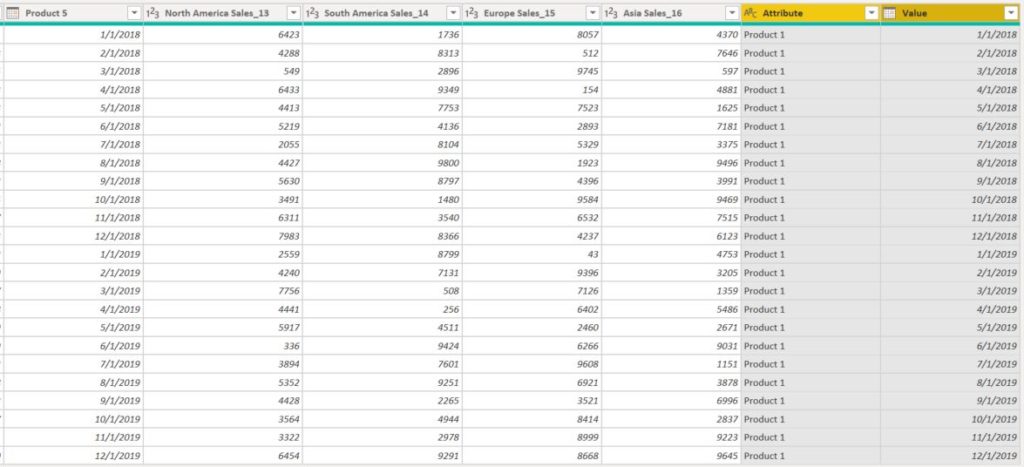
Example input sales data formatted in rows:
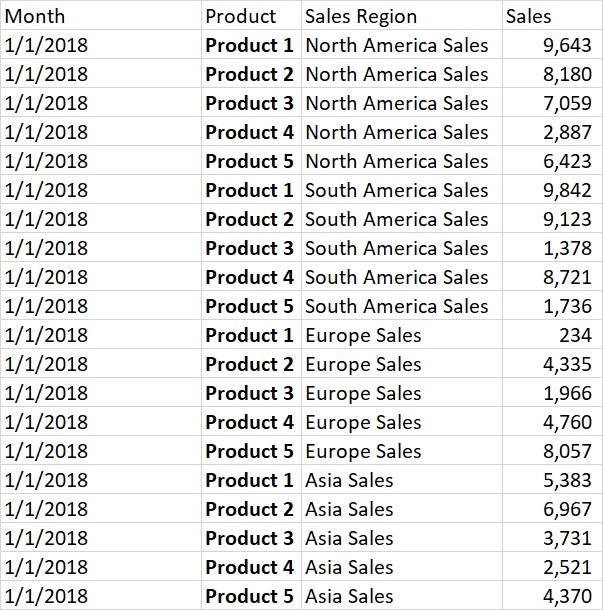
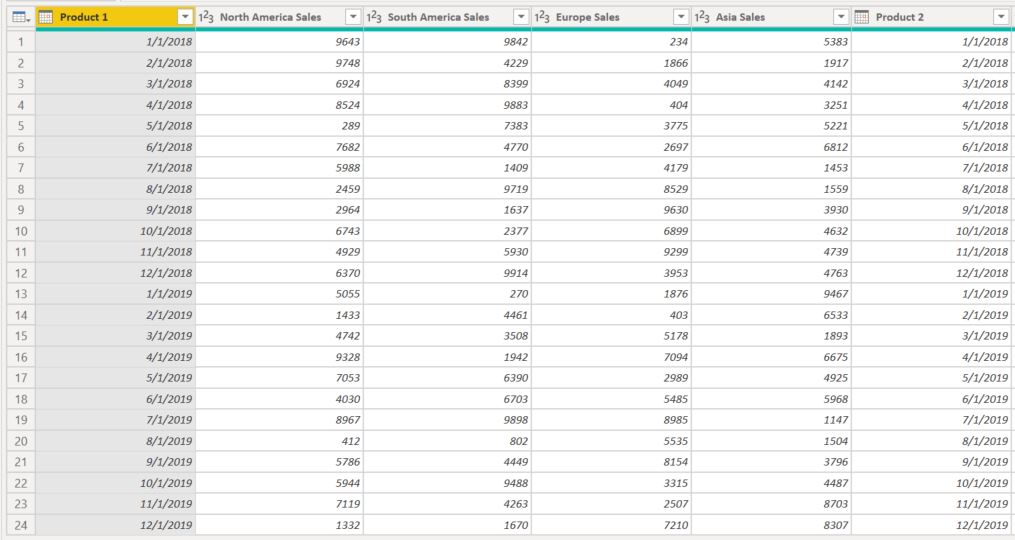
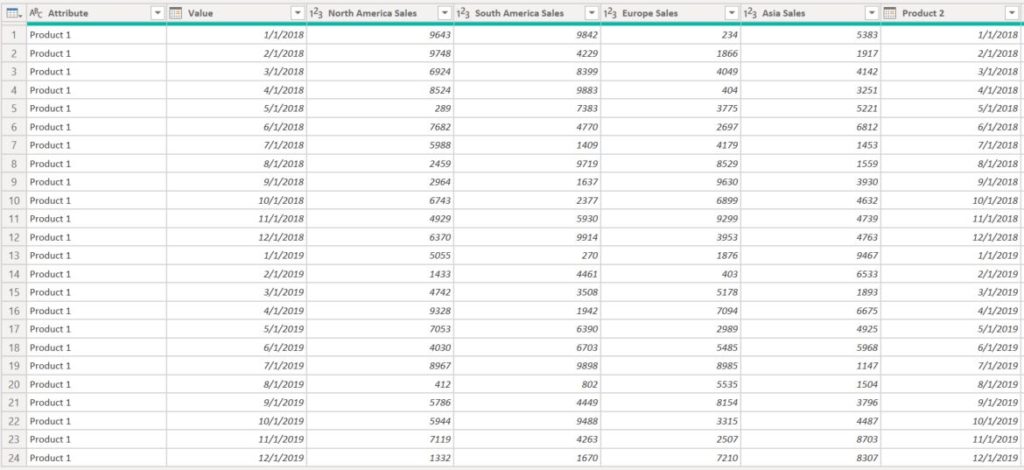
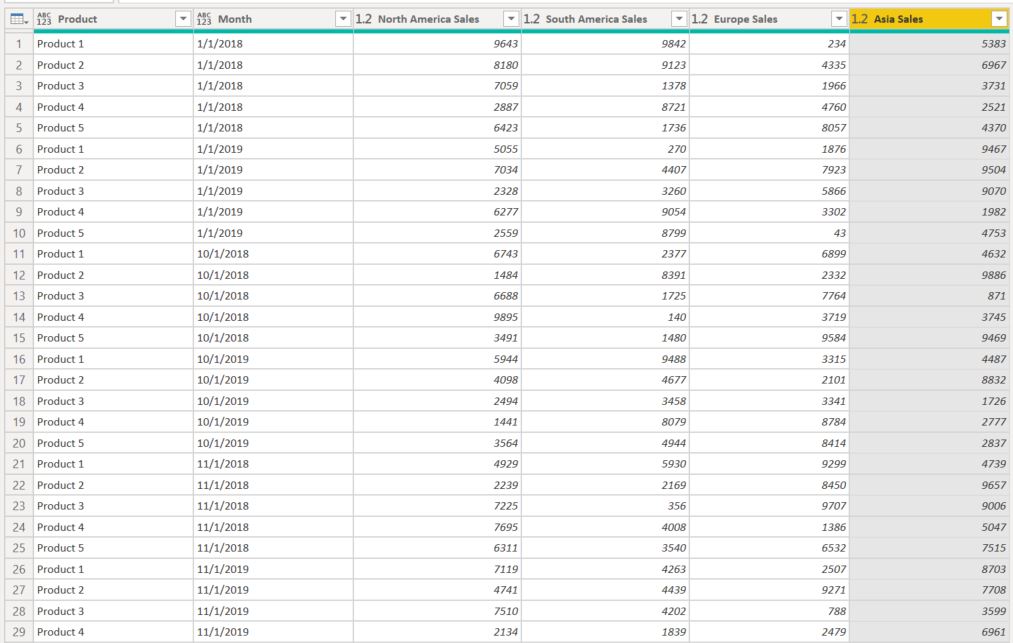
Desired data formatted into columns:
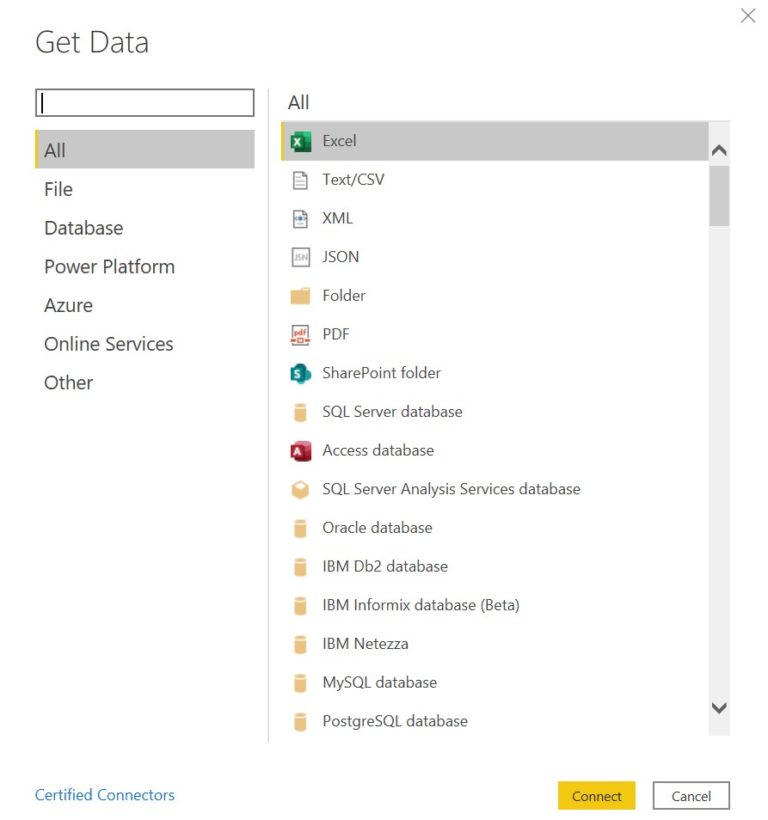
Import Data into Power BI
The first step is to import the data into Power BI, for this example we are using a basic excel data connection.
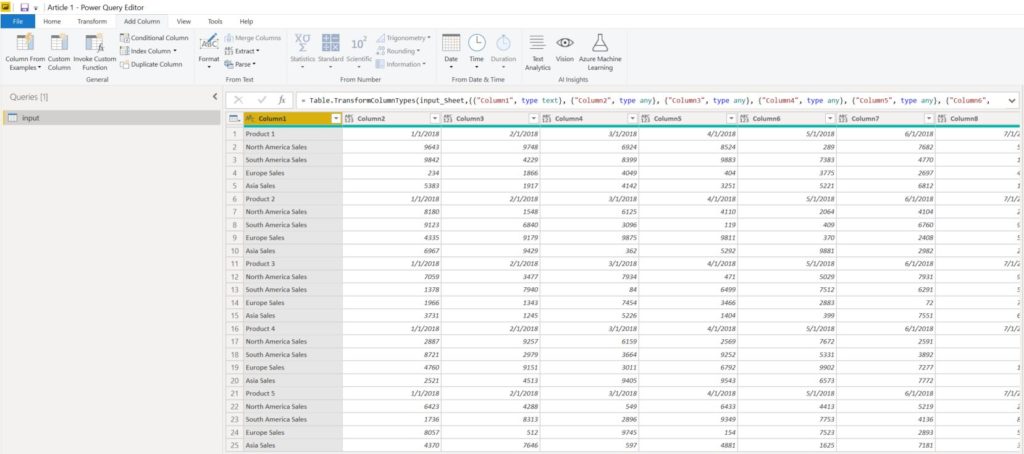
Transpose and Unpivot the Data
Once the data is loaded into your model navigate over to the Power Query Editor and it should look similar to the example data we are using.
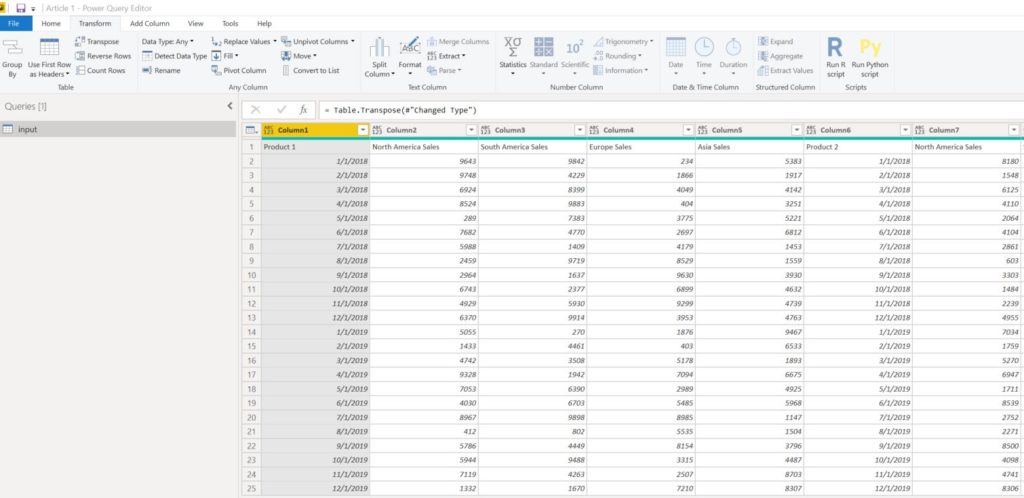
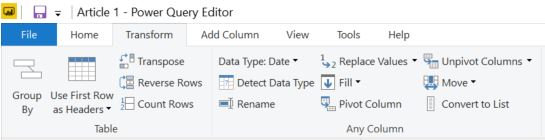
Next select the Transform tab and select Transpose.
The data should now be in the following format.
Navigate over to the Home tab and select Use First Row as Headers.
Now we need to Unpivot each of the Product columns and move them back to their corresponding locations within the data set. In our example we highlight Product 1 and under the Transform Tab select Unpivot Columns.
The Unpivoted column will appear to the far-right side of the data set so we need to move it back to the beginning, in our example we move the Product 1 column and Month column in front of the North American Sales column for Product 1.
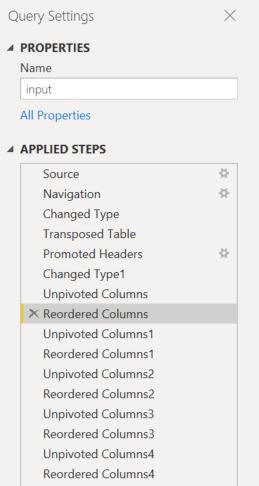
Repeat this step for each Product category and at the end of this process the Applied Steps should look similar to this.
Merge the Columns
Next navigate to the Transform tab, select all of the columns and click Merge Columns and choose Semicolon from the Separator drop-down menu.
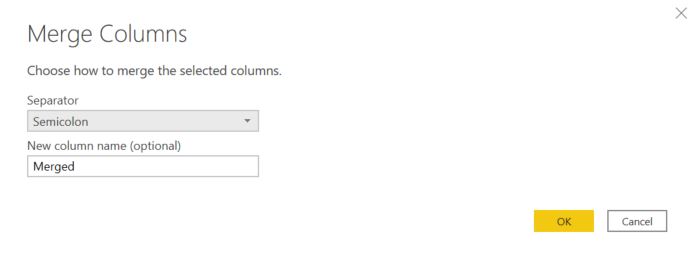
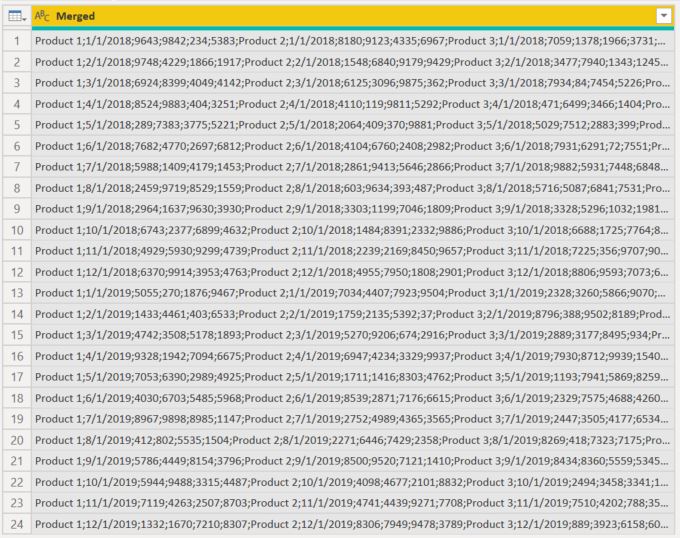
The result will look similar to this.
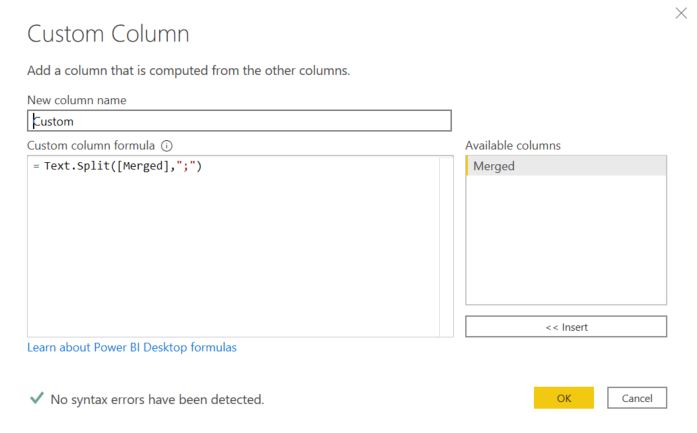
Next under the Add Column tab select Custom Column and use the Text.Split formula:
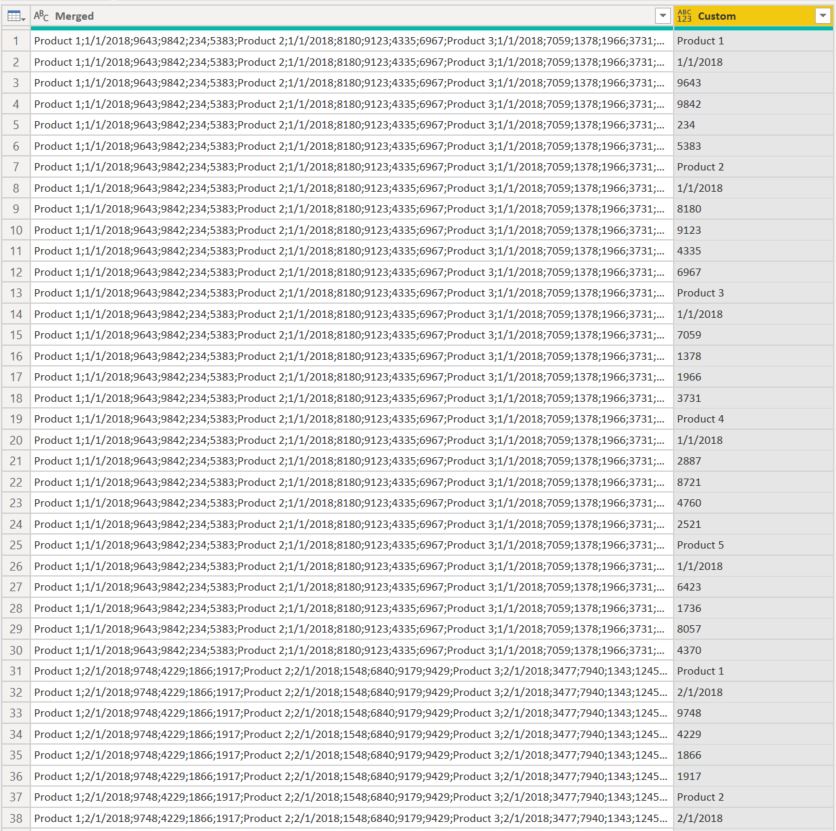
= Text.Split([Merged],”;”)
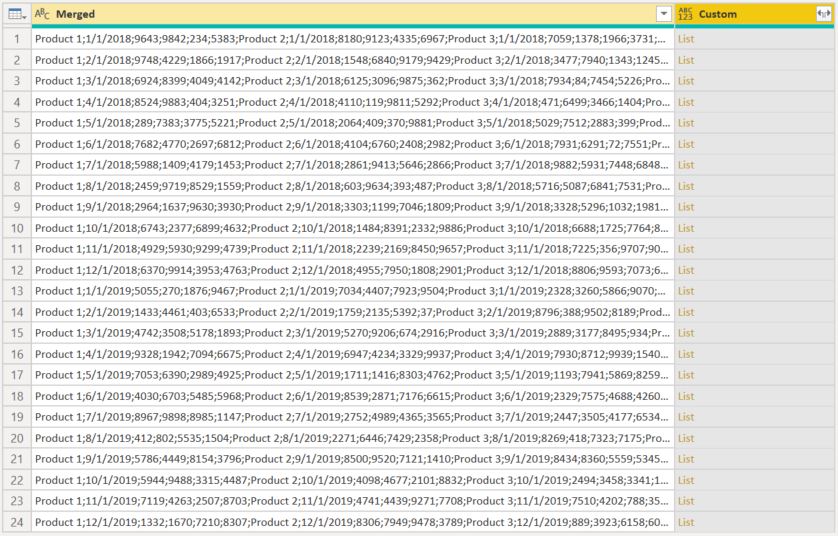
On the new Custom column, click the top right arrow symbol and select Expand to New Rows.
Insert Modulo Column
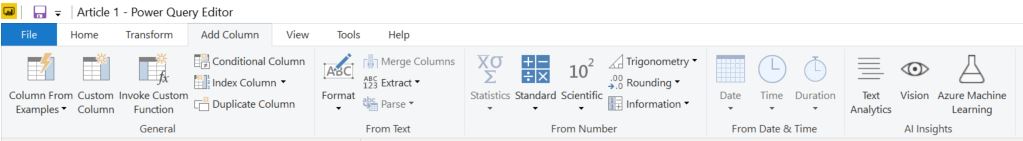
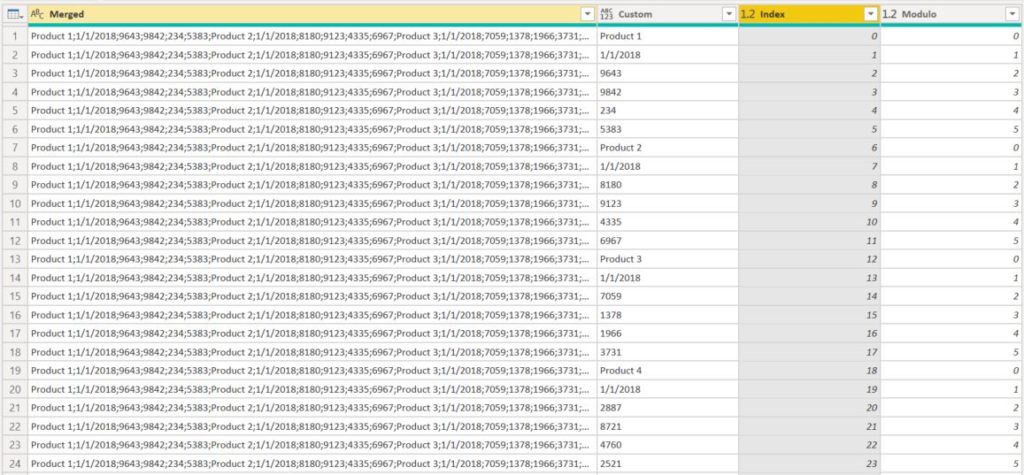
Under the Add Column tab insert Index Column From 0. Also under the Add Column tab under the From Number section select the Standard drop-down and select Modulo.
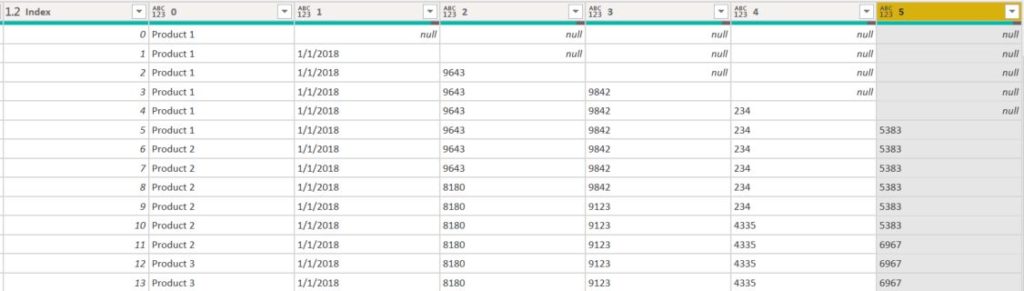
This where you would enter the number of rows before they repeat again, the Modulo column starts at zero and calculates a number for each row up to the number entered and then in repeats again until the end of the data set. In this example we have six columns before Product 2 so the Modulo column will enter 0 to 5 for the Product 1 rows then 0 to 5 for the product 2 row and so on. It is useful at this point to note what Modulo number corresponds to each row. In this example 0 = Product 1 = Month 2 = North America Sales 3 = South America Sales 4 = Europe Sales 5 = Asia Sales.
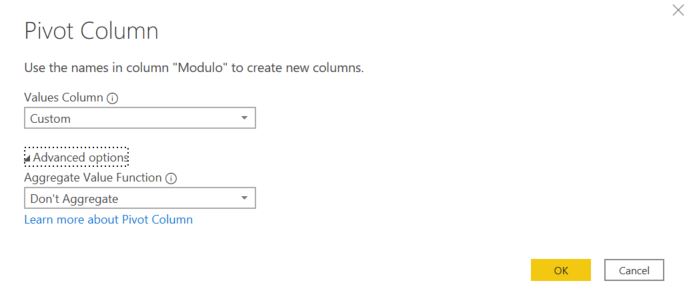
Pivot the Modulo Column
Now we will highlight the Modulo column we inserted and under the Transform tab select Pivot Column. In the Values Column drop down select the Custom column we added and expand the Advanced Options section and select Don’t Aggregate.
Once we have the data pivoted, we simply fill down for each column and once this is complete right click on the far-right column and select Remove Duplicates. You can also delete the Merged and Index columns as well as update the column labels. The row input data has now been formatted into columns, which is a useable format for completing additional calculations in your Power BI model.
It is always a challenge to get input data into the desired format, this guide went through the steps to convert a relatively common row data format into columns. One limitation of this method is there cannot be any duplicate values in the dataset. A workaround is to include decimals in the input figures. Hopefully this guide provides some ideas for specific use cases, many different variations of this method can assist with data formatting, enabling greater functionality in your Power BI models.