One of the most common slicers used in Power BI is a date slicer drop-down, allowing users to filter or slice large data sets by year or month. This is relatively easy to accomplish if the Power BI model only has one data feed but what if the model has multiple input data sources? When I was first starting out in Power BI this is one of the first features I tried building into my data models, but I couldn’t find a concise tutorial. This guide will walk through setting up a date slicer with multiple input data sources and how to setup the required relationships.
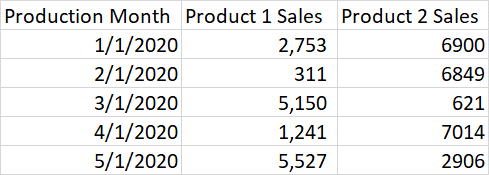
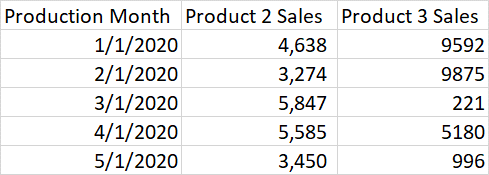
In this example we have the following dataset for each company division:
Company Division 1 Dataset
Company Division 2 Dataset
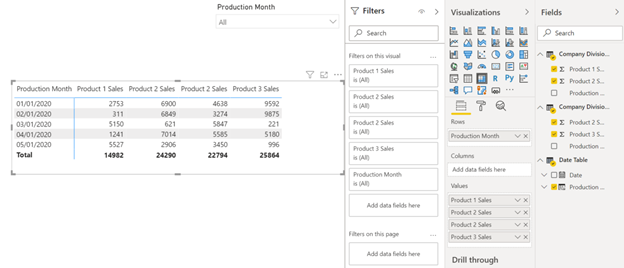
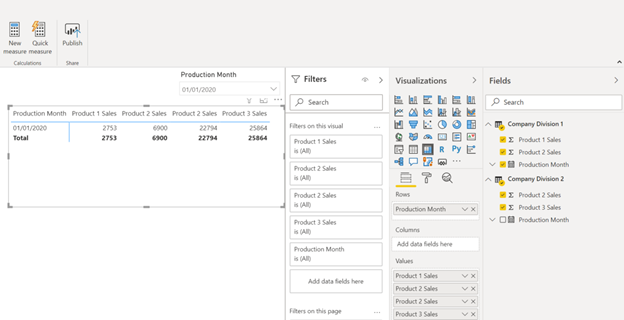
When we import this data into Power BI, we can create a simple matrix with a drop-down to display our data. You can see that we are using both datasets selected in the Fields section on the right side.
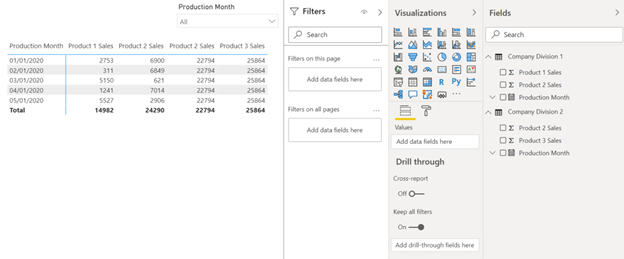
An issue arises when we remove the date slicer, you will notice that the data from Company Division 2 isn’t displaying properly. This is because we don’t have a date table and the corresponding relationships needed to properly display the data from two separate datasets.
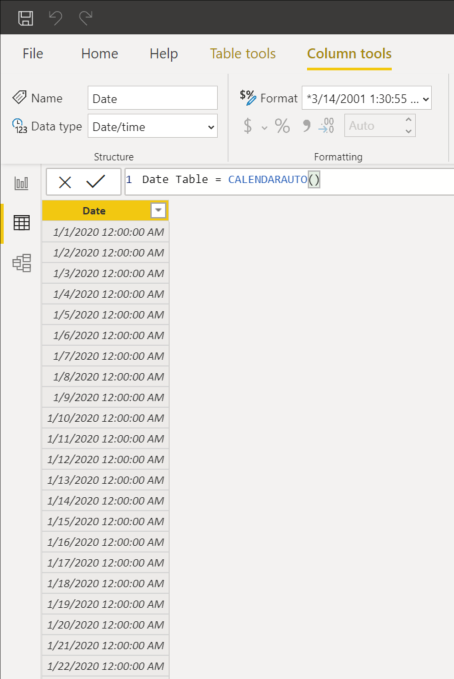
There are several ways to accomplish setting up a date table in Power BI, the method we use in all of our models is to create a new table using DAX. We can use the CALENDAR and CALENDARAUTO functions to create a new table.
First navigate over to the Modelling tab and select create a New Table.
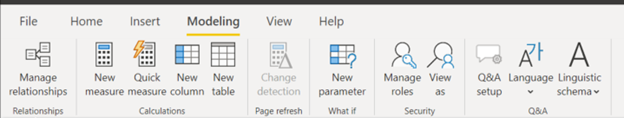
In the formula bar name your new table, in this example we used Date Table = CALENDARAUTO(). This function will automatically look at the data in your Power BI model and will fill in a date range. This is convenient because we don’t have to manually find the date range for our data. In this example our data starts at January 2020 and goes until May 2020 so CALENDARAUTO() gave us date entries for each day from January 1, 2020 to December 31, 2020. If you want to manually select the date range to use in your model the CALENDAR() function can be used with the parameters being the desired start and end dates.
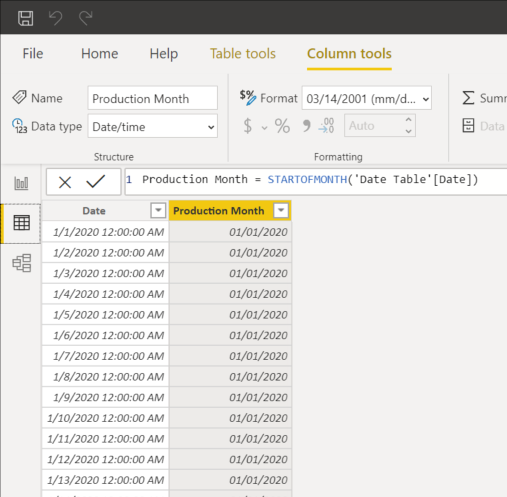
Next since we don’t want to filter on each day of every month we will create another column using the DAX function STARTOFMONTH(). In this example we entered Production Month = STARTOFMONTH(‘Date Table'[Date]) and then under Column Tools, formatted the Production Month column into MM/DD/YYYY.
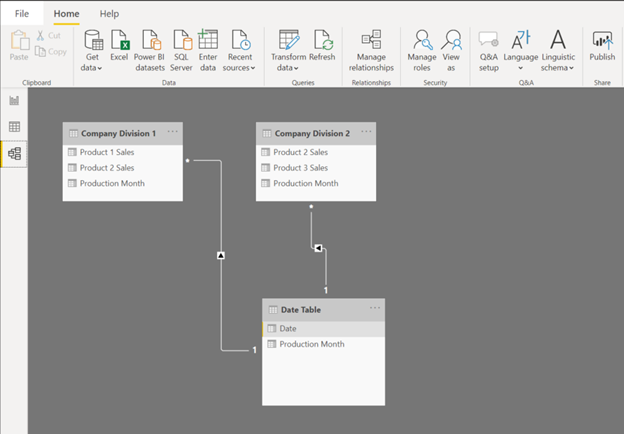
Lastly navigate over to the Model tab on the left and drag the Production Month from Company Division 1 and Company division 2 to the date column creating a relationship. The are many different types of relationships we can create but the default relationships that Power BI establishes will work for this example.
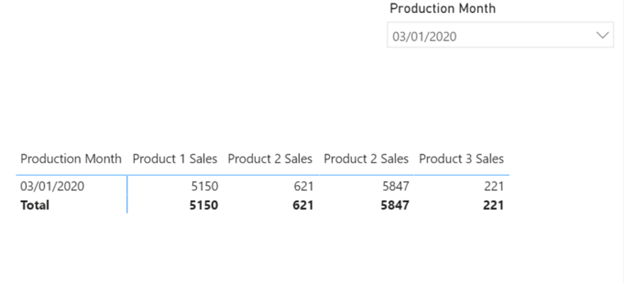
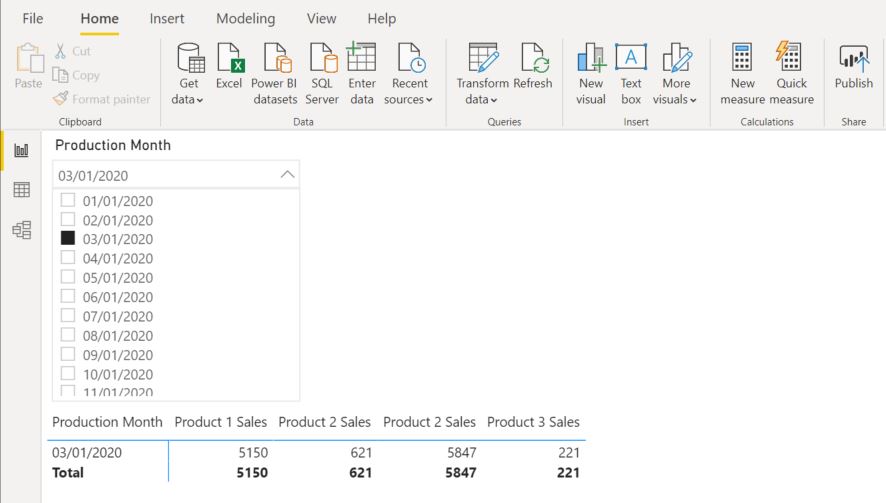
Now on the report tab we can create a Table or Matrix using the Production Month field from the Date table and add in each of the Product 1 Sales, Product 2 Sales, Product 3 Sales fields. We can also create a drop-down slicer using the Production Month column from the Date Table that will allow us to create a functioning date slicer drop-down that is commonly used in Power BI models. There are many different ways to accomplish this but hopefully this article will get you started on using tables and relationships.